Advanced Population Genetics
The Extended Edition of Breeders Assistant includes advanced population genetics tools to help with mate selection and population analysis.
Many of the features described here are demonstrated in the 'Mate Selection, Kinship And Population Analysis' tutorial and in several of the videos. The tutorial can be used with any version/edition of Breeders Assistant v6+.
Finding Prospective Matings - Mate Selection

Breeders Assistant can take a group of potential parents - a set of sires and dams - and rank (prioritize) the prospective matings between every possible sire/dam pairing as a tool to making better breeding decisions.
There are three different ways of prioritizing the prospective matings:
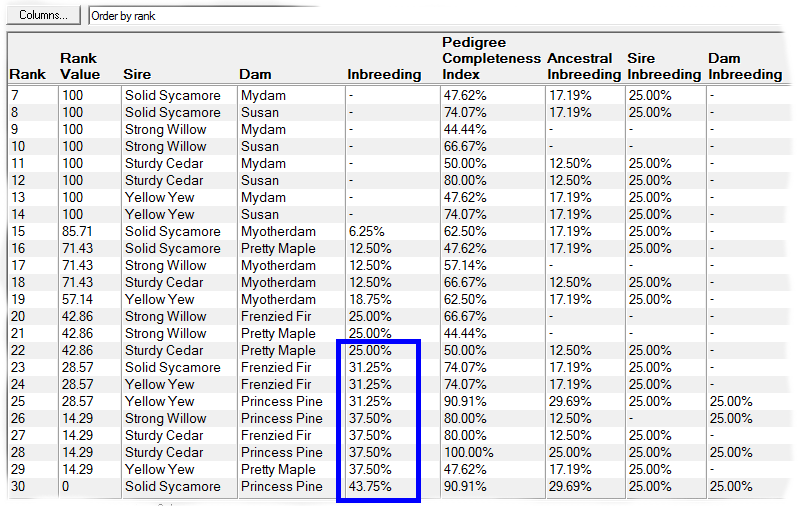
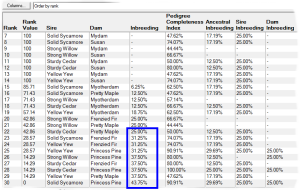
Rank By Inbreeding - This ranks according to the inbreeding of the potential offspring, and possibly also the inbreeding and pedigree completeness indices (PCI values) of the parents. The PCI value is a useful means of incorporating the reliability of the inbreeding coefficient into the ranking algorithm: when insufficient ancestry is available the computed inbreeding coefficient may be unrealistically low and it may be desirable to avoid such matings. See video ![]()
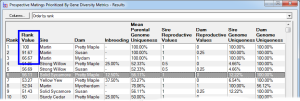
E.g. the first screenshot shows a list of prospective matings that have been ranked by increasing inbreeding in the potential offspring. The inbreeding that each mating would give rise to is shown along with related values and a ranking value that varies from 100 (best) to 0 (worst). The matings can be ordered in various ways e.g. by inbreeding, by sire, by dam, by sire inbreeding, etc.
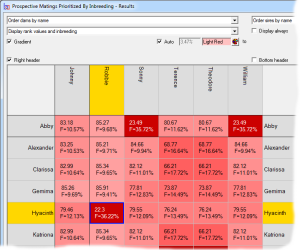
Prospective matings can also be displayed as a matrix with the sires along the top and the dams down the side. In this case each cell shows the ranking and, optionally, other computed values related to the mating. The cells can be color coded according to the ranking. In the second screenshot the prospective inbreeding is shown, color coded with lighter colors indicating a lower (better) inbreeding.
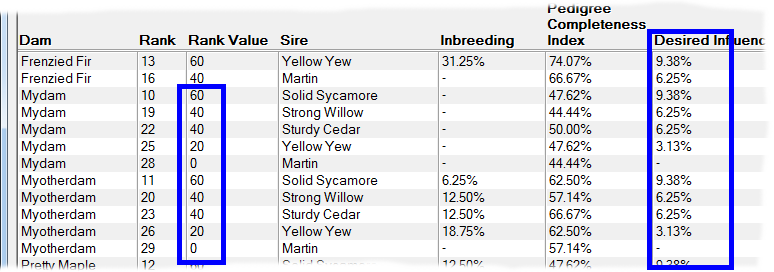
Rank By Influence - This ranks by taking into account the extent of kinship the potential offspring will have with chosen individuals that have either 'desired' or 'unwanted' influence. It gives higher priority to matings where the potential offspring will have greater kinship with the desired individuals, and lower priority to those with greater kinship to unwanted individuals. See video ![]()
An important application of this technique is when there are key individuals within your breed that are particularly 'good' in some respect e.g. adherence to a breed standard, and you wish to breed to maximize the kinship the offspring will have in relation to those individuals. It is not necessary for these influential individuals to be ancestors. They just need to be related in some way through shared ancestry and - of course - both they and their ancestors need to be in your database.
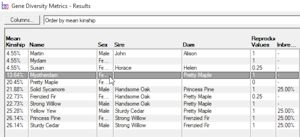
Rank By Gene Diversity Metrics - This ranks by taking into account metrics concerning overall genetic diversity of a breeding pool, such as changes in mean kinship or to prioritize prospective matings to favor those that will increase the representation of genes from under-represented founders, or from parents with higher genome uniqueness, and other measures of genetic diversity. See video ![]()
How To Use - The way all these prospective mating prioritization tools are used is broadly the same:
- Select the required option from the Tools|Prospective Matings menu.
- Define the prospective parents, and associated information such as the depth of ancestry to be considered and the 'reference date' (from which age-related information that can be used when selecting parents is determined).
- In the case of the 'By Influence' and 'By Gene Diversity Metrics' prioritization methods, additional individuals need to be defined (those with desired/unwanted influence, or the breeding pool).
- Rank weightings may optionally be customized - these influence the ranking algorithm.
- Results are displayed, either as a list of prospective matings ordered by ranking (and many other ways), or as a matrix where the columns represent the sires and dams in rows.
- Results are used either by browsing the displayed results on screen, or by exporting to a text/CSV file (for external use) or by selecting and creating actual mating records within the software.
Needless to say, all these tools require that you have the necessary breed ancestry - i.e the animals and their ancestors to sufficient ancestral depth - in your database.These tools work by analysing relationships between individuals for which you have the data and ancestral links.
Computing Population Genetics Metrics - Population Analysis


A number of tools are available to compute inbreeding coefficients and various measures of genetic diversity such as mean kinships and genome uniqueness values. These are all accessed using the Tools|Population Analysis menu.
Results are displayed either in tables ordered in various ways, or in some cases with color coded matrices e.g. for a relationship matrix or a matrix showing the individual contributions of each founder to every individual in a breeding population.
Results can be exported to text/CSV files e.g. for transfer to a spreadsheet for further analysis.
The following reports are available:
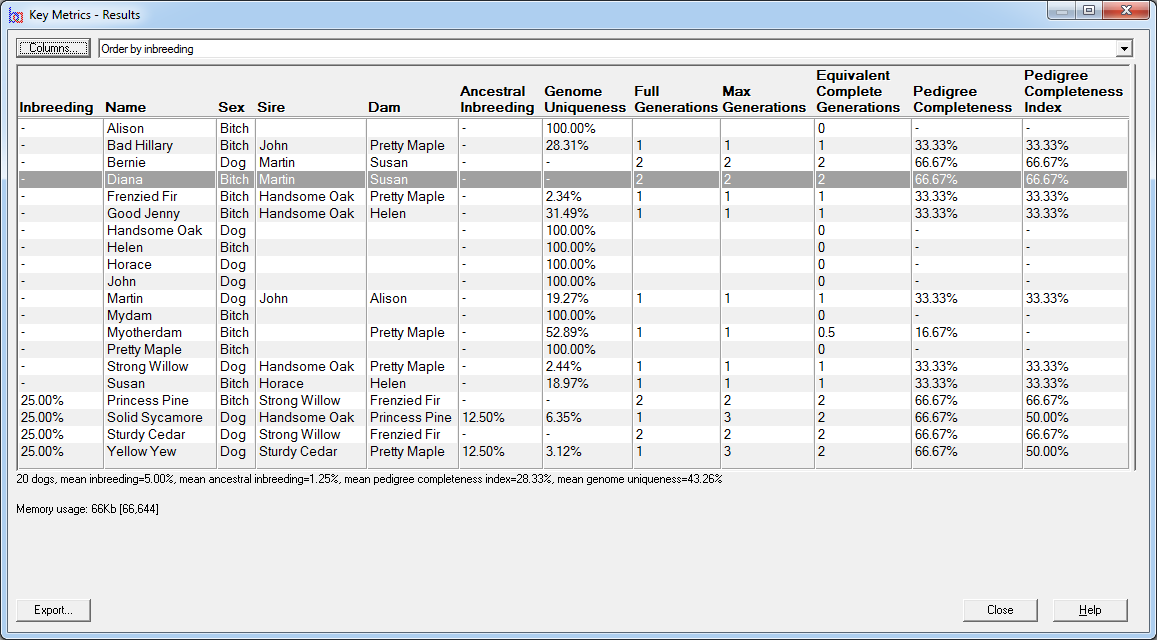
Key Metrics - Computes inbreeding coefficients, pedigree completeness data such as pedigree completeness indices, ancestral inbreeding, and genome completeness coefficients for a given set of individuals. See video ![]()
Founder Metrics - Computes the contribution, alleles retained, and founder genome uniqueness of all the founders of a given set of individuals with respect to that set. Normally used to compute founder metrics of the current breeding pool of a closed population. This report also includes the number of founder equivalents, the number of founder genome equivalents, and the number of effective ancestors within the set of individuals under study. See video ![]()
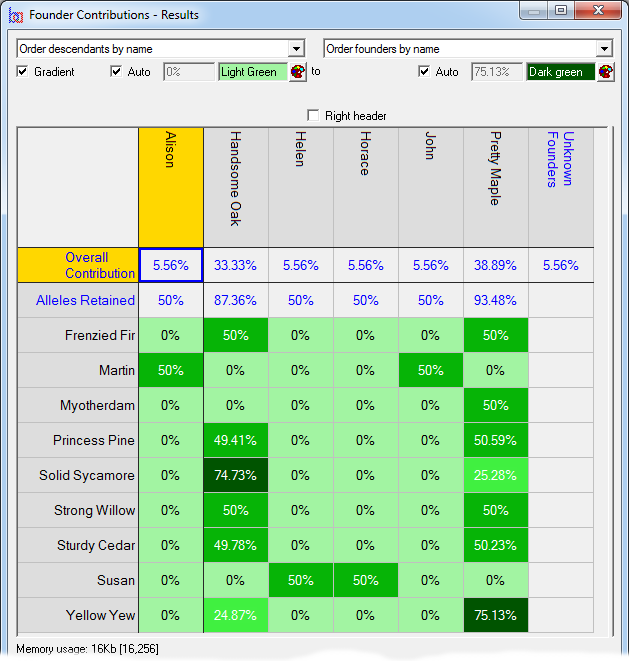
Founder Contributions - Analyses the estimated contributions made by each founder to each individual, separately, in a given set of individuals with respect to that set. Normally used to compute the individual founder contributions to each individual of each founder of the current breeding pool of a closed population.
Founder Genome Uniquenesses - Analyses the founder genome uniqueness of every founder with respect to each individual in a given set of individuals.
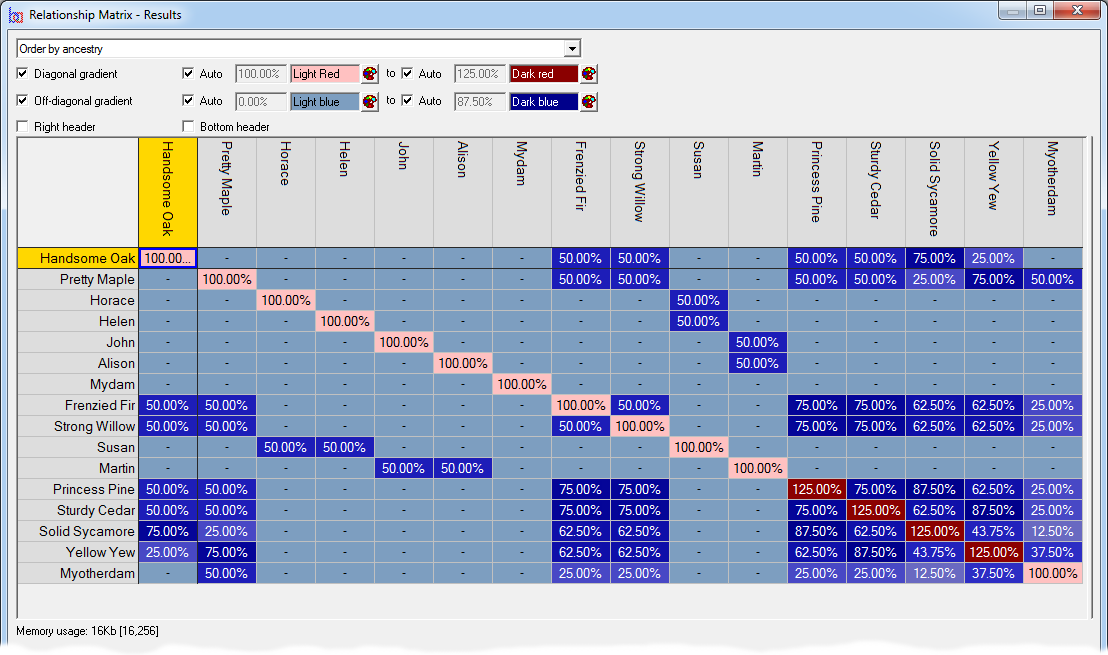
Relationship/Kinship Matrix - Displays a relationship matrix of additive genetic relations (also known as the 'NRM' or 'A' matrix), or a matrix of of kinship coefficients, of a given set of individuals, their ancestors and optionally descendants. See video ![]()
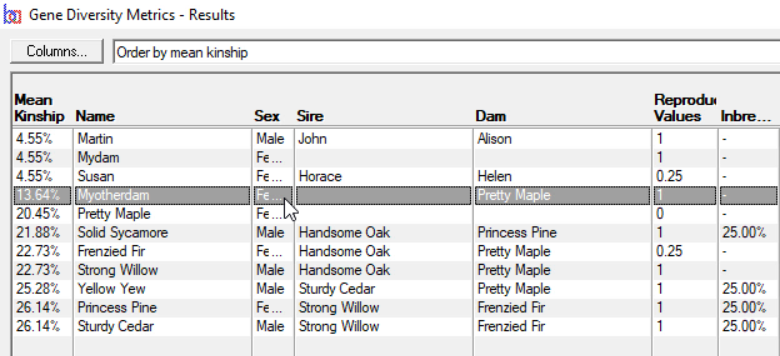
Gene Diversity Metrics - Computes mean kinships and genome completeness coefficients for a given set of individuals. This is typically used to find gene diversity metrics of the current breeding pool of a closed population. See video ![]()
Effective Ancestors - Computes the most effective ancestors, i.e. influential ancestors, behind a given set of individuals (using the method of Boichard, D, Maignel L, and Verrier, E. "The value of using probabilities of gene origin to measure genetic variability in a population", Genetics Selection Evolution, 1997; 29(1): 5-23).
Videos
There are several videos on this site that demonstrate some of these features:
| Inbreeding |
How to display inbreeding, fix 'self-parenting' errors (circularities), and introduces how the Extended Edition can compute inbreeding in bulk and find prospective matings to minimize offspring inbreeding. |
| Extended Edition: Test Data And How To Define The Breeding Pool |
Introduces the test data set used in the Extended Edition population genetics videos, and shows how to set up a 'breeding pool'. |
| Extended Edition: Ranking Prospective Matings In Depth |
In depth introduction of the various ways the Extended Edition can be used to rank prospective matings. |
| Extended Edition: Measures Of Genetic Diversity In Depth |
In depth introduction to the various advanced population genetics reports of the Extended Edition. |
| Extended Edition: How To Choose Prospective Matings To Minimize Inbreeding |
How to use the Extended Edition to rank prospective matings to minimize inbreeding in the offspring, and how to display mate rankings as a colour coded grid. |
| Extended Edition: How To Choose Prospective Matings Using Influential Individuals |
How to use the Extended Edition to rank prospective matings according to the influence (kinship) of specific individuals. |
| Extended Edition: How To Choose Prospective Matings Using Mean Kinship And Other Gene Diversity Metrics |
How to use the Extended Edition to rank prospective matings using mean kinship and other measures of genetic diversity. |
| Extended Edition: Bulk Computation of Inbreeding, Genome Uniqueness and Pedigree Completeness |
How to compute inbreeding, genome uniqueness and pedigree completeness in bulk, using the Extended Edition. |
| Extended Edition: How To Display A Kinship Matrix |
How to display a kinship/relationship matrix, using the Extended Edition. |
| Extended Edition: How To Compute Mean Kinships |
How to compute mean kinships for the breeding pool, using the Extended Edition. |
| Extended Edition: Founder Analysis - How To Compute Founder Equivalents, Contributions And Related Metrics |
How to analyse founder contributions and compute founder equivalents, using the Extended Edition. |
For a full list of available videos click here.
Population Genetics Concepts And Terminology
Identity by State
If both alleles for a given gene locus are the same, an individual is homozygous for that gene. The phrase 'identical by state' means the same thing: the alleles are functionally the same. If the alleles are different, the individual is heterozygous for that gene.
Identity by Descent
Two alleles are said to be identical by descent if one of them is a physical copy of the other, or if they are both physical copies of the same allele in a particular ancestor. If two alleles are identical by descent then by definition they must also be identical by state but not vice versa.
Kinship
The kinship coefficient between any two individuals is the probability, for any particular gene locus, that an allele selected randomly from one individual is identical by descent to an equivalent allele selected randomly from the other. Also known as coancestry.
Breeders Assistant can use kinship values when prioritizing prospective matings according to the influence of known individuals. This is where the software ranks prospective matings to weight either for or against prospective matings that would result in offspring that share more or less kinship with the specified individuals.
To view kinship coefficients directly Breeders Assistant can generate a relationship/kinship matrix for a set of individuals and their ancestors. This is accessed using the Relationship/Kinship Matrix option of the Tools|Population Analysis menu.
Mean Kinship
The mean kinship (MK) of an individual within a group of individuals (breeding pool) is the mean of its kinship coefficient with every other member of the group, including itself. If an individual's mean kinship is low, this means it is less related, on the whole, to the rest of the breeding pool than an individual with a higher MK.
MK plays an important part in breeding decisions in programmes designed to maintain genetic diversity in small populations. Leaving aside other factors, if it is necessary to choose between one sire and another for a mating decision, it would be better to choose the one with lower MK.
When using MK it is helpful not to forget that it is the mean kinskip of an individual with respect to every other member of the group of individuals for which it is computed. The main use of MK is to help make decisions as to which sire to mate to which dam in order to maximize the retention of genetic diversity. There is little practical benefit in including individuals that are unavailable for breeding (e.g., are deceased ancestors) within the group against which MK is computed.
Breeders Assistant can compute mean kinships for a set of individuals as part of its 'gene diversity metrics' analysis. This is accessed using the Gene Diversity Metrics option of the Tools|Population Analysis menu.
It is also possible to use mean kinship as a ranking factor when prioritizing prospective matings.
Gene Diversity
The gene diversity (GD) of a breeding population is defined as 1 minus the 'mean MK'. That is to say it is 1 less the arithmetic mean of the mean kinships of every individual in the breeding pool.
The lower the mean MK, the less related the individuals in the breeding pool are. Gene diversity is simply another way of looking at the mean MK value, but with a number where higher is better.
One of the ranking metrics when prioritizing prospective matings is 'GD Delta' - which is defined as the change in GD that results from the addition of a single offspring from a given mating. If GD increases as a result of a mating, that means the overall genetic diversity of the population has gone up. So the higher the GD delta, the better.
Ancestral Inbreeding
The ancestral inbreeding coefficient of an individual is the cumulative proportion of an individual's genome that has been previously exposed to inbreeding in its ancestors (see Ballou, JD. "Ancestral Inbreeding Only Minimally Affects Inbreeding Depression in Mammalian Populations", Journal of Heredity 1997, 8:169-178.).
Pedigree Completeness
This is a measure of the completeness of a pedigree. It is the sum total of the proportion of the ancestors that were traced at each generation for a certain number of generators, divided by that number of generations, shown as a percentage. E.g. if 3 generations of ancestors were traced for an individual where both parents are present (i.e. proportion 1.0), 2 grandparents are present (proportion 0.5), and 3 great-grandparents (proportion 0.375) then the pedigree completeness value would be (1.0 + 0.5 + 0.375) divided by 3 which is 0.625 or 62.5%.
Pedigree Completeness Index
The pedigree completeness index (PCI) is another measure of the completeness of the pedigree, and probably the most useful. It is the harmonic mean of the pedigree completeness values for the parents of an individual, so long as both parents are present, otherwise it is zero. Because it is the harmonic mean it weights the result to the lower of the parental pedigree completeness values.
This value is computed using the method of MacCluer et al ("Inbreeding and Pedigree Structure in Standardbreed Horses", Journal of Heredity 1983, 74:394-399). PCI can be useful when deciding how much importance to give to an inbreeding value. Informally, if insufficient ancestry is available then a low inbreeding coefficient is not a reliable guide to the true level of inbreeding. When selecting prospective matings by inbreeding Breeders Assistant can use weightings for the sire and dam PCI values in the overall ranking. It is possible to specify a PCI threshold to exclude prospective matings that have a PCI value below a given value.
Reproductive Values
A individual in the current population that is no longer reproductive e.g. a female nearing the end of her life, is of no value in maintaining future genetic diversity (because she can no longer produce offspring to add to the population). Such individuals should not be included in the breeding pool if possible.
Likewise it follows that if there are, say, two sires with the same mean kinship, but one is older than the other, then - and ignoring any other factors - it may be desirable to give a greater priority to breeding from the older sire first, to lessen the risk that its genes are lost for good. And yet calculations based on pure mean kinship - such as GD Delta - do not take this into account.
In order to allow for such considerations to contribute to the mating selection, Breeders Assistant can use a 'reproductive value' for each individual in conjunction with the ranking factors. The reproductive value can vary from 0 to 1 where 0 means the individual is entirely unreproductive and 1 means 'fully reproductive'. Thus an older individual might have a lower reproductive value.
Founders
A founder within a set of pedigree data is defined as an individual where neither the sire nor dam is known. Such an individual may truly be a 'founding ancestor' of a breed or 'population' in the sense that it is not related to any other founder, or it may be related - possibly closely - to other members of the group but the details of its lineage are not known. Within Breeders Assistant founders are treated as unrelated and non-inbred.
Many of the features of the population analysis and mate selection tools of the Extended Edition of Breeders Assistant involve determining the ancestors of an individual or group, and then computing various metrics or analyses based on them. In most situations Breeders Assistant provides a way to artificially restrict the depth of ancestry considered. E.g. it may be limited to 16 generations. Whenever such an artificial cutoff is applied, the definition of founder takes on a slightly different meaning: it means an individual, within the subset of the population that comprises the individuals under study and however many generations of their ancestors that has been selected, that either has no known sire and/or dam or whose sire and/or dam, even though present in the database, do not fall within the subset under study. It is as if the software 'pretends' that the deeper ancestry is simply unknown.
Genome Uniqueness
The genome uniqueness (GU) of an individual with respect to a current population of which it is part is the probability that it contains founder alleles not present in any other single (normally) individual in that current population.
This latter point is crucial to understand - the whole purpose of the GU measure is to identify individuals within a breeding population that are likely to carry genes from founders where there is little or no representation of those genes in other members of the breeding population.
The term 'normally' is used here because Breeders Assistant lets you configure what is meant by genome uniqueness, in that you can define that number of individuals in the current population for which, if any given founder's alleles are only present in that number, or fewer, of the current population, then it is considered 'unique'. This setting can be altered using the Extended Edition tab of the Configure|Preferences window.
Breeders Assistant can compute genome uniqueness for a set of individuals and their founders as part of its 'gene diversity metrics' analysis. This is accessed using the Gene Diversity Metrics option of the Tools|Population Analysis.
It is also possible to use genome uniqueness as a ranking factor when prioritizing prospective matings. I.e. to prioritize matings so as to minimize loss of genetic diversity within a breeding pool.
Genetic Drift, Founder Equivalents and Founder Genome Equivalents
The founders of a population under study contain all the genetic diversity available to be inherited by their descendants. However, not necessarily all of the genetic variation present in the founders may have 'made it' to the current population, due to genetic drift, selection and inbreeding.
Genetic drift refers to the loss, by chance, of genetic diversity present in the founders. E.g. when a founder has only one offspring, but that offspring is then the ancestor of one or more members of the current population, then by definition at least half of the genetic diversity that was present in that founder must have been lost. That is because it's sole offspring only inherited half of it. Even when a founder has many offspring and from which there may be large numbers of descendants in the current population, it is not likely that all its genes will still be present.
Larger populations, with larger numbers of founders, large families and little or no selection i.e. truly random mating usually maintain genetic diversity. Genetic diversity can be increased through mutation and migration i.e. the introduction of truly unrelated 'new' founders. But within smaller populations, including 'closed' populations of fancy animals such as dogs and cats or with endangered species where there are very limited numbers of individuals remaining, the extent of retained genetic diversity can be limited, and the extent to which different founders are represented within the current population can vary, sometimes greatly.
The number of founder equivalents (Lacy, RC. "Analysis of founder representation in pedigrees: Founder equivalents and founder genome equivalents". Zoo Biology 8:111-124, 1989.) is a measure of the genetic diversity of a current population. It is the number of equally contributing founders that would be expected to produce the same level of genetic diversity as the current population. It has a standard symbol in population genetics literature: fe. In a large population with no selection and in the absence of genetic drift fe remains relatively constant because founder contributions do not vary much from one generation to another. When there is extensive selection fe can lose value, such as with fancy animals when popular sires can give rise to huge numbers of offspring and hence magnify the representation of their founders within the current population at the expense of those of unpopular sires.
The number of founder genome equivalents is a related measure which, unlike the number of founder equivalents, takes genetic drift into account. It is the number of equally contributing founders with no random loss of alleles in the offspring that would be expected to produce the same level of genetic diversity as the current population. It has standard symbol fg. The calculation of fg is more involved than fe because it requires knowledge of the extent to which each founders alleles have been retained in the current population i.e. the degree of genetic drift. This can be calculated using a gene drop analysis. fg will always be less than or equal to fe.
The number of effective ancestors (fa) is similar to the number of founder equivalents except that it also takes into account bottlenecks in the pedigree structure. This number will always be less than or equal to the number of founder equivalents (fe). To arrive at this number it computes the marginal contribution of each ancestor - not just the founders - to the current population to find the ancestor with the most influence, and then repeats the process taking care not to consider the contribution of any previously identified influential ancestor more than once until no more 'significant' ancestors are found. For details of the method used see (Boichard, D, Maignel L, and Verrier, E. "The value of using probabilities of gene origin to measure genetic variability in a population". Genetics Selection Evolution, 1997; 29(1): 5-23.).
Breeders Assistant can compute the number founder equivalents, founder genome equivalents and effective ancestors for a set of individuals as part of its 'founder metrics', 'effective ancestors' and 'gene diversity metrics' analyses. These are accessed through the Tools|Population Analysis menu.
Gene Drop Analysis
A gene drop analysis (MacCluer, JW, VandeBerg JL, Read B and Ryder OA. "Pedigree analysis by computer simulation". Zoo Biology 5, 147/160, 1986.) is a computer simulation technique for analyzing a group of individuals comprising a current population and their ancestors.
The founders of the group are first identified. The algorithm then simulates Mendelian inheritance by 'dropping' a gene, comprising pair of unique alleles for each founder, 'through' the pedigree. The actual alleles that the current descendants have 'received' are then counted up. The whole process is then repeated, usually many thousands of times. By counting the frequencies of the alleles the descendants end up with, it is possible to work out good approximations for various metrics that otherwise would be difficult to work out exactly.
Breeders Assistant uses gene drop analysis for the computation of genome uniqueness, and the proportion of alleles retained in the current population from any given founder.
The number of rounds used in the gene drop analysis is a preference setting.